Introduction
Once you have established the hypothesis you want to test, decided on an experimental design, and selected the response and predictor variables you will measure, you need to figure out how to collect the information necessary to answer your study question. This tutorial will introduce you to some of the sampling methods you can use to collect your data. At the end of this tutorial, you will find a list of references that will describe how to establish sampling strategies and collect field data in much greater detail.
Sampling is about selecting and measuring representative examples of your subject of interest. As such, it is fundamentally concerned about the spatial (and temporal) arrangement of your population of interest within its environment. In order to figure out the appropriate sampling technique, you need to ask yourself several questions.
1. What is it that you are trying to sample?
The answer to this question should be firmly embedded in your hypothesis. It is the first question to answer when establishing a sampling design because its answer will set the spatial and temporal boundaries on your sampling area. As in the developing hypotheses tutorial example of bird diversity in two fields, the subject of interest would be the bird communities present at these two locations. From a sampling standpoint, your study area would then be delimited by the two fields (and possibly their surrounding habitats, depending on your hypothesis). Similarly, if bird use of the fields varied during the day, you may also need to set temporal boundaries by restricting your sampling to the morning hours when many bird species are more active.
If your hypothesis concerns the abundance or distribution of dandelions in neighborhood lawns, your sample unit will be either individual lawns or sections of one lawn. However, if you are looking at the length of leaves on dandelions, then your sample unit will be individual dandelion plants. This may seem obvious, but it is important to clearly understand where you will (and will not) be collecting information.
2. What is the appropriate sampling unit?
If you are sampling attributes of individuals (for example, the length of leaves on dandelions, elytra on ladybugs, or the number of fruit on shrubs), the sample unit is the individual. Ecologists will often define a limited spatial area in which their research subjects may be found. Within this area, called a quadrat or plot, they search for occurrences of their research subjects, often measuring attributes of any examples they find. When using quadrats or plots, it is important to make the size of the sample unit proportionate to the size of the organism(s) being studied. For example, herbaceous vegetation, such as wildflowers or grasses, is often sampled using a 1 m2 quadrat; however, sampling trees will require much larger plots—100 m2 to 400 m2—or plotless distance-based methods. For mobile organisms, such as birds, you might record the number of individuals at a certain location over a fixed duration of time. See the sample methods section on the next pages for more detailed information about how to implement these various techniques.
3. Where will you place (or how will you select) your sample units?
This is an important consideration in your sampling design. Randomly (or systematically) locating your sample units is an important way to limit bias in your study. Random sample selection is also a fundamental assumption of most statistical analyses (as is the assumption that samples are independent from one another). For the purposes of your research project, randomly located sample units are not essential in all circumstances—a study of bird behavior or abundance at different bird feeders would be an example—but it is best practice and should be employed whenever possible. Different ways of placing or selecting sample units are discussed on the following pages.
Sample Placement
Simple Random
Using this scheme, each sample unit is randomly selected. Specifically, this means that each sample unit has an equal probability of being selected and that the selection of any one sample unit does not influence the selection of any other sample unit.
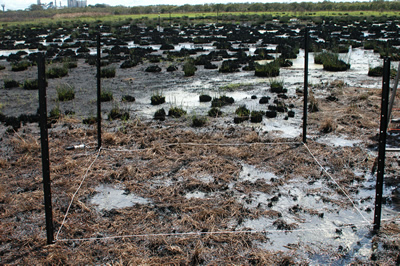
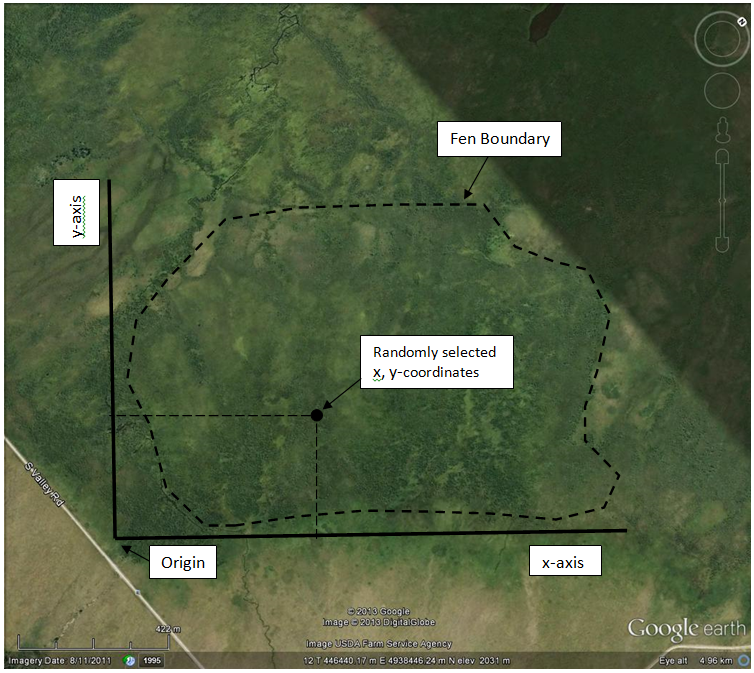
For example, say you wanted to sample the wetland pictured here (click on the image to see it full size). With a simple random scheme, you could “construct” imaginary baselines (the x- and y-axes) and then use a random number generator (a computer, a table of random numbers, or a list of numbers blindly pulled out of a hat) to randomly select x- and y-coordinates. Using a compass, you could then pace off or measure your way to the coordinates. This is where you would then place or locate your sample unit (for example a plot or the nearest shrub). You could also use GPS, or even Google Maps or Earth on a tablet or smart phone, to select and locate coordinates. You would repeat this exercise until you had collected a sufficient number of samples.
Sample Placement
Stratified Random
This is a useful technique to employ when your study area is not uniform but contains subareas with different physical or environmental conditions. Examples of this would be an old field that contains both grassland and shrub patches or a wetland that contains different vegetation zones (open water, marsh, wet meadow, upland transition) depending on water level. Each differentiated subarea, internally environmentally uniform but different from one another, is termed a stratum. A purely random selection method will not necessarily ensure that all the different strata will be sufficiently sampled. As the name implies, stratified random sampling first divides the study area by strata and then selects random samples from within each stratum. Sampling effort by strata can be determined based on the size of each strata (for example, a strata occupying 40% of the study area would receive 40% of the sample effort) or by other variables (perhaps some strata are harder to reach than others and so receive a reduced sampling effort).
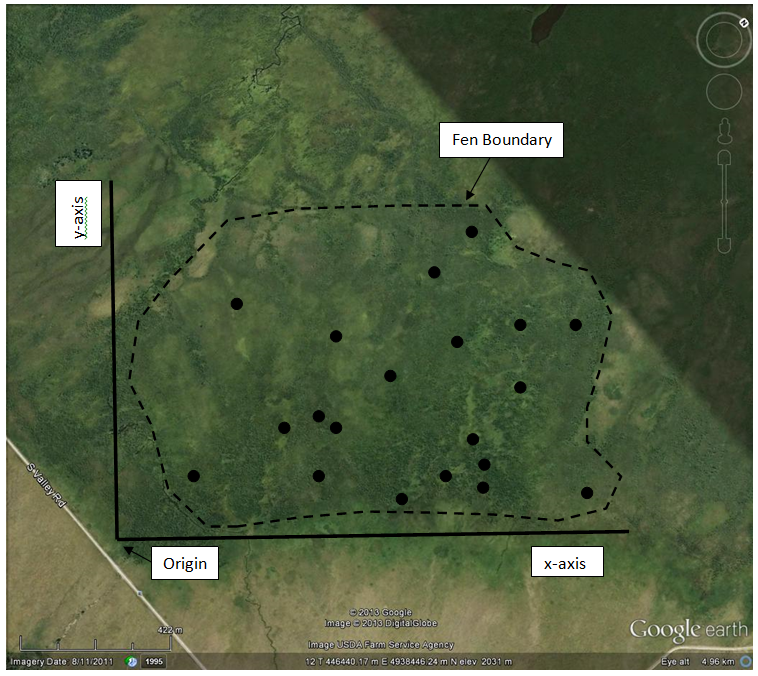
Consider the fen example again. Let’s say that the total sampling effort consists of 20 plots. After the random selection, this image shows the locations that were selected (click on the image to see it full size).
Sample Placement
Stratified Random
|
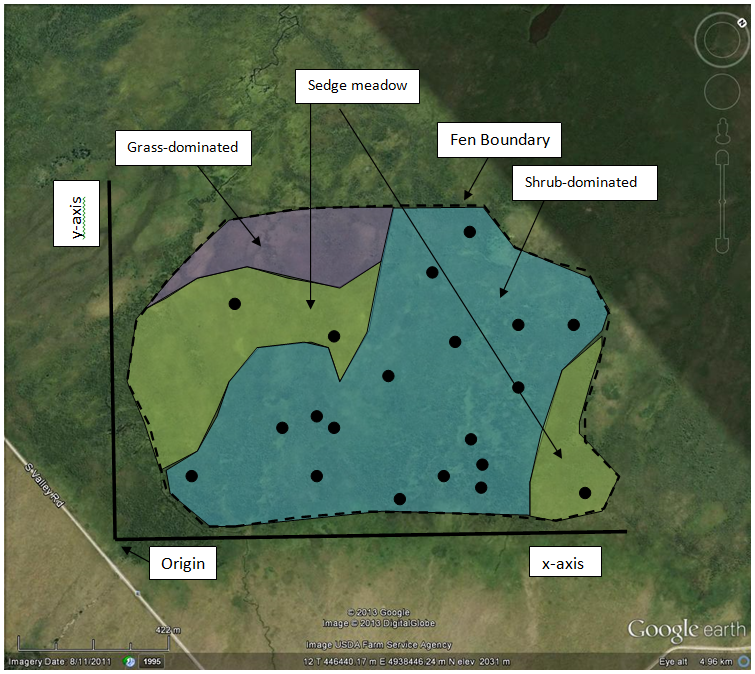
But our fen is not homogenous. It contains shrubby areas, sedge meadows, and some grass-dominated sections. Relative to these habitat types, the grass-dominated area is completely unsampled, and the sedge meadows are underrepresented. |
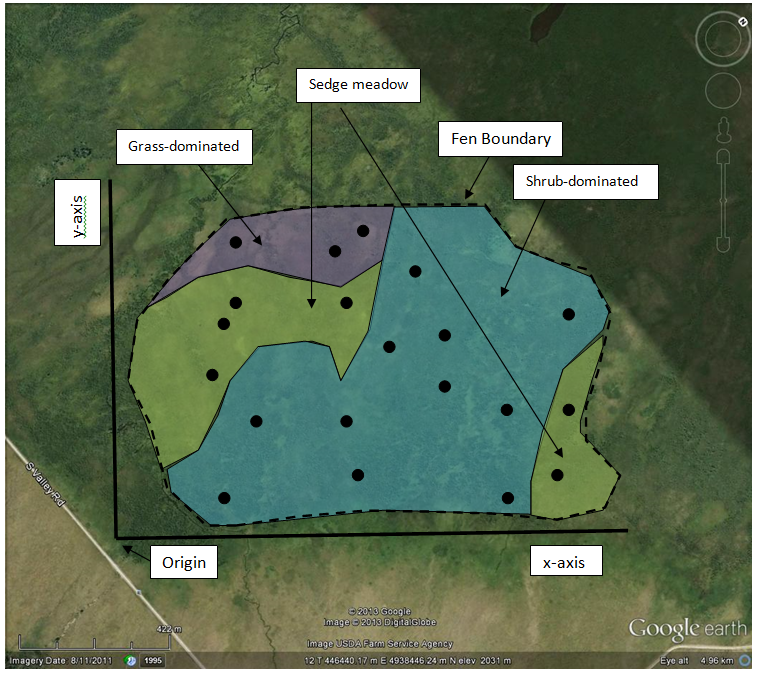
By stratifying first, and making the sampling intensity roughly equivalent to spatial extent, you could randomly place 3 plots in the grass, 6 in the sedge meadow, and 11 in the shrubland. |
|
|
Sample Placement
Systematic
Another approach is to systematically place samples. This is often occurs with transect sampling where plots are placed at regular distances along the transect. Systematic sampling can be more time efficient than randomly choosing each sampling location. If the initial sample point is randomly chosen, then a systematic sampling scheme can also satisfy the statistical assumption of randomness. Systematic sampling can be problematic if the sample points correspond to some underlying environmental pattern.
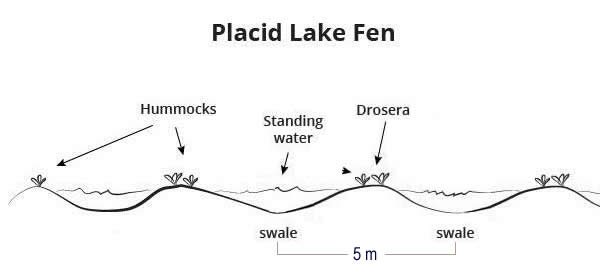
Let’s use the Placid Lake example from the developing hypotheses tutorial. If the undulating mound-hollow topography had a regular occurrence, with mounds—then hollows—recurring every 5 m, and you systematically sampled every 5 m, you would only ever sample the same topographical position. However, nature is not usually so tidy, and in practice this is not typically a concern.
Sample Placement
Haphazard
Finally, samples can be placed subjectively or opportunistically. There is a long tradition of subjective sampling when developing classifications of plant communities. In this tradition, researchers often sample representative examples of plant communities, which are subjectively chosen. Sometimes researchers sample unique habitats or features, such as salt licks or bird feeders, which are attractants to the organisms that they want to study.
Strictly speaking, haphazard sampling does not allow for the use of conventional statistical analysis.
Sampling Methods
Plots and Quadrats
Plots and quadrats delimit spatial areas within which the researcher searches for their subject of interest. This approach is very commonly used in studies of vegetation. As previously mentioned, the size of the sample unit is scaled proportionate to the type of vegetation being studied. For herbaceous species, such as wildflowers and grasses, small plots called quadrats are typically used. Quadrats vary in size, but commonly range in area from 0.1 m2 to 1.0 m2 and are usually square or rectangular in shape. Woody vegetation is usually much bigger than 1 m2 and shrub and forested communities are often sampled using larger plots ranging in area from 100 m2 to 400 m2 of square, rectangular or circular shape. Herbaceous vegetation can also be measured in larger plots and often is. For example, in a study comparing vegetation between two forest types using 400 m2 plots, all the vegetation, woody and herbaceous, would be sampled.
How to Make a Quadrat
|
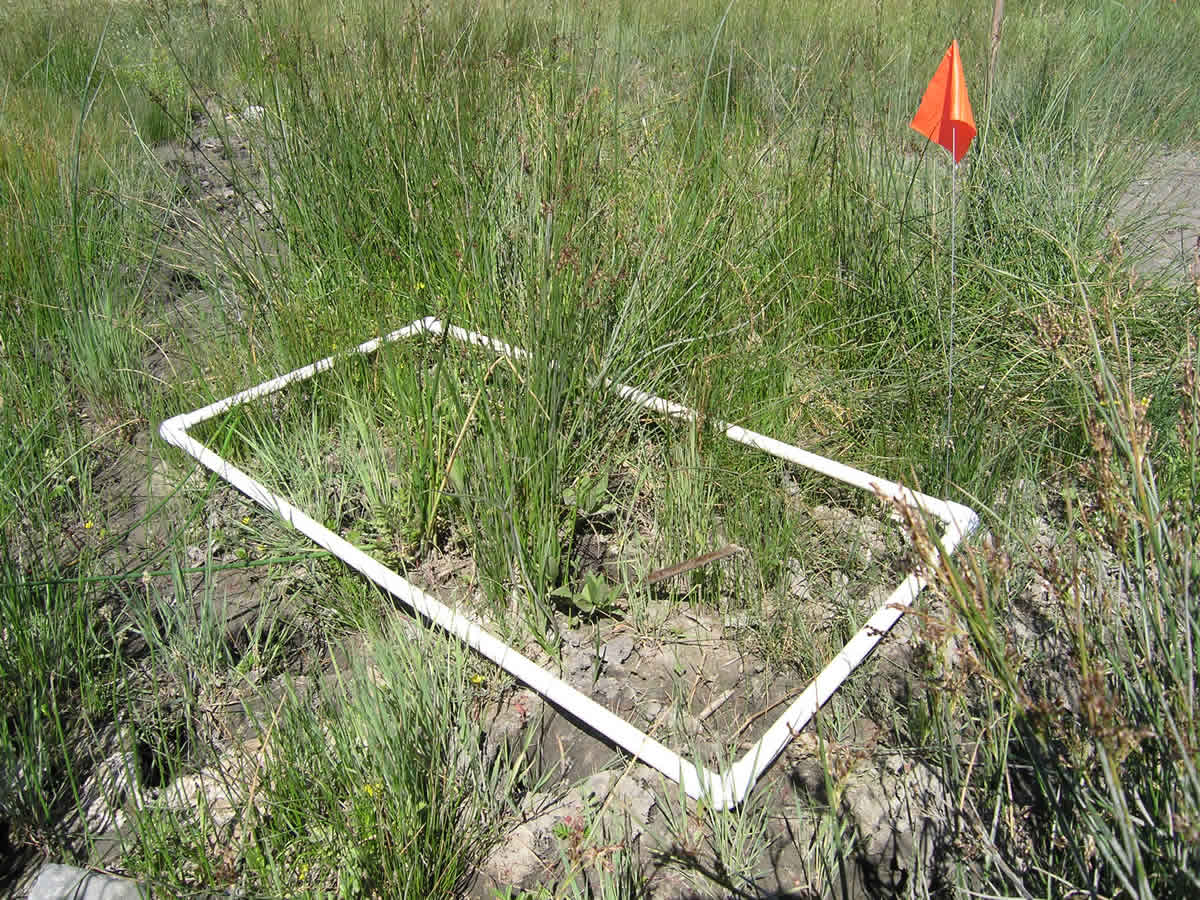
Quadrats are easy to construct out of PVC pipe, readily available at hardware stores and home centres. Using ½ or ¾ inch pipe, cut the pipe with a PVC cutter or hacksaw to the required lengths and connect them with PVC elbow joints. For example, to make a 0.25-m2 square quadrat you would cut 4 0.5-m sections of pipe. Image to the right: |
|
|
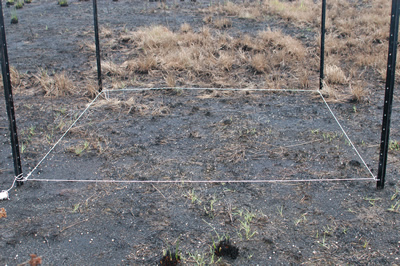
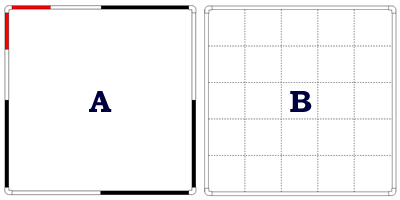
If you are estimating the abundance of your subject within the quadrat, you can spray paint the sides of the quadrat different colors or drill holes in the PVC at specific intervals through which you would thread rope or twine. This will help you estimate the proportion of the quadrat occupied by your subject. Images to the right: |
|
Sampling Methods
Plots and Quadrats
Once the sample unit has been laid out, the presence or abundance of the item being studied is measured. Depending on the research question, this could be the number of dandelions, the cover of grass, or presence of all the plant species found in the sample unit. You can also use plots and quadrats to measure other response variables, such as animal tracks and scat or animal and insect browse damage.
What/How to Measure
There are several ways to measure your subject of interest. By far, the simplest measure is presence/absence. If your subject occurs within the sample unit (quadrat or plot) or at the sample location (point count) it is present, if not, it is absent. Things get slightly more complicated if you want to measure the abundance of your subject of interest. There are various measures of abundance, including counts, density, frequency, and cover.
If your study research subject can be counted as individuals (e.g., birds, insects, or certain discretely occurring plants such as dandelions and most trees) you can count the number of individuals. If you are counting individuals within a known area, as is the case for quadrats and plots, you can express the count as an estimate of density: the number of individuals per unit area. Density can also be calculated for distance-based methods. With the nearest individual method, density per hectare (10,000 m2) is:
where 2 is a correction factor
With the point-centered quarter method, density per hectare is:
with no correction factor
Frequency is the number of times a subject was present when you have multiple samples or subsamples. It is a useful surrogate for abundance because it can be estimated from presence/absence data, which is quick and easy to collect. For example, if you are observing the presence/absence of a certain type of flower in quadrats along a transect, the frequency of occurrence would be the number of quadrats in which the flower was present divided by the total number of quadrats sampled. You can also use frequency within quadrats. For example, if you used rope or twine to create a grid for your quadrat, you could observe the presence/absence of your research subject within each grid cell and estimate its abundance within the quadrat as its frequency of occurrence.
A common measure of abundance in vegetation is cover. This is usually measured as the percentage of the sample frame that is under the canopy of a particular plant species or type of vegetation. Because it is difficult to accurately measure this percentage, plant ecologists often estimate cover within cover classes. Here are examples using broad cover classes:
Cover class |
Range of coverage |
Midpoint of range |
1 |
0-5% |
2.5% |
2 |
5-25% |
15.5% |
3 |
25-50% |
37.5% |
4 |
50-75% |
62.5% |
5 |
75-95% |
85.0% |
6 |
95-100% |
97.5% |
When collecting data on cover, usually the cover class or the (rounded) midpoint in the range of each cover class is recorded. For the above example, you could record either {1, 2, 3, 4, 5, 6} or {3, 16, 38, 63, 85, 98}.
Another type of cover, basal area, is often used for trees, especially in distance-based methods. With basal area, the circumference of the tree at breast height (1.4 m) is measured and converted into an estimate of area:
where C = circumference, r = radius, and A = area
Thus r = C/2 π and A = C2/4 π
Finally, you may be interested in recording other attributes of your subjects. What you measure will depend on the question you are investigating and could be almost anything: height, weight, sex, developmental stage, number of leaves/flowers/fruits, condition, etc.
Sampling Methods
Transects
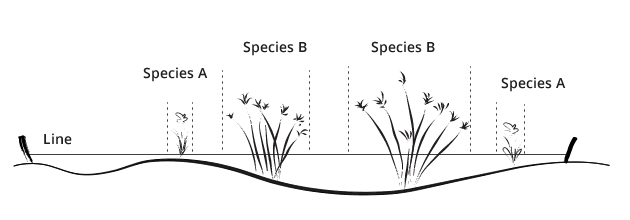
Transects are another common sampling method. At its most simple, a transect is just a line (which could be string, rope or a tape measure) that stretches from point A to point B. This version is called a line-intercept and is often used to sample grass and shrubland vegetation. You record the extent of the line that intersects each species, or kind of plant, for a quick estimate of abundance.
Transects can also be extended to either side to form long, skinny plots or belt transects. For example, a 50 m transect that extended for a meter on each side of the line, would form a 2 m × 50 m belt transect. The entire plot can be sampled, but often smaller quadrats are placed at regular intervals along the transect as subsamples. For example, along a 30 m transect, 1 m2 quadrats could be placed every meter on alternate sides of the line.
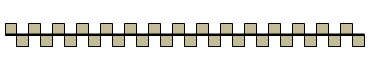
Figure. Example of a 30 m transect with multiple 1 m2 quadrats placed on alternate sides of the transect at 1 m intervals.
Where multiple sampling locations are placed along a transect, it is important to think about what the sample unit is. In the preceding case, the quadrats are located closely to one another, and it would be difficult to consider them independent samples. In this case, the transect should be the sample unit and the individual quadrats, the subsamples. In contrast, if the quadrats were placed far enough away from each other, they could be considered independent samples. The minimum distance required to make independence a reasonable assumption will vary depending on what is being studied. For moss it might be a meter, for herbaceous plants it might be several meters, for birds it might be a hundred meters or more. Transects are often employed in systematic sampling and can be a very useful technique for sampling along environmental gradients.
Sampling Methods
Distance-Based
|
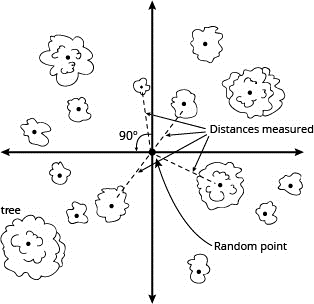
When sampling organisms that don’t move, such as plants, distance-based methods can be used as an alternative to plots or quadrats. Distance-based approaches can be an efficient sampling method when your research subject is an individual species or group of organisms. They were developed, and are most commonly used for, sampling trees in forested habitats. In the simplest form, the nearest individual method—the individual nearest to a randomly chosen point—is recorded and its distance to the random point, measured. In a slightly more complex technique, the point-centered quarter method, the area around the random point is split into four quarters and the nearest individual in each quarter is recorded and its distance to the center point measured. The random points are often selected along a transect, which helps facilitate quartering the area around the selected point. |
|
Sampling Methods
Point Counts
|
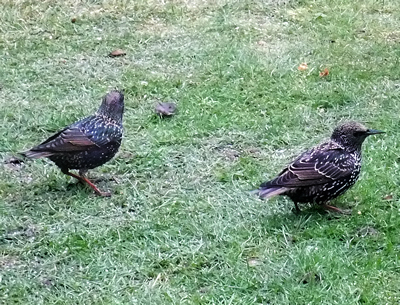
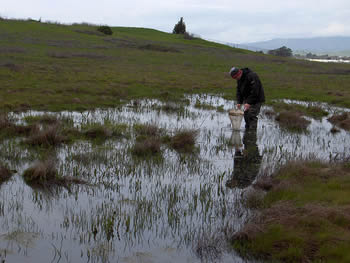
Point counts are often used when sampling bird communities. A point is selected and observed for a fixed amount of time (usually 5 or 10 minutes). When sampling song birds, whose activity levels vary over the day, point counts are often conducted in the morning from dawn to 10:00 am. This time frame may be less important for other kinds of birds, such as waterfowl, or for birds in specific settings, such as at feeders. The research question will determine what is recorded: all the birds seen or heard in the time period, the number of waterfowl on a pond, or the presence of osprey at a perch. A point count approach can also be used for other types of animals, such as mammals, although a longer observation period (perhaps an hour) may be required. |
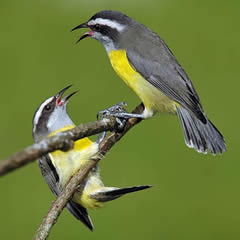
Photo credit: Bojarczuk, L. (2007). Two Bananaquits quarreling on a branch. Retrieved from: http://commons.wikimedia.org/wiki/File:Bananaquits.jpg?fastcci_from=3153835
|
Additional References
The Resource Information Standards Committee (RISC), a government ministry of the Province of British Columbia, maintains a website with links to government documents that cover sampling and monitoring techniques for a variety of organisms and ecosystems.
This link, http://www.for.gov.bc.ca/hts/risc/pubs/index.html, will take you to a page where you can search for content via categories. The terrestrial ecosystems—biodiversity category (http://www.for.gov.bc.ca/hts/risc/pubs/tebiodiv/index.htm) may be the most useful as it provides links to documents describing inventory methods for different groups of organisms.
Specific manuals that might be of interest include:
- BC Ministry of Land, Environment and Parks. 1999. Inventory methods for forest and grassland songbirds, version 2.0. Standards for components of British Columbia’s biodiversity, No. 15. BC Ministry of Land, Environment and Parks, Resources Information Branch. URL http://www.for.gov.bc.ca/hts/risc/pubs/tebiodiv/songbird/assets/songml20.pdf
- BC Ministry of Land, Environment and Parks. 1999. Inventory methods for waterfowl and allied species, version 2.0. Standards for components of British Columbia’s biodiversity, No. 18. BC Ministry of Land, Environment and Parks, Resources Information Branch. URL http://www.for.gov.bc.ca/hts/risc/pubs/tebiodiv/waterfowl/assets/waterfowl.pdf
- BC Ministry of Land, Environment and Parks. 1998. Inventory methods for terrestrial arthropods, version 2.0. Standards for components of British Columbia’s biodiversity, No. 40. BC Ministry of Land, Environment and Parks, Resources Information Branch. URL http://www.for.gov.bc.ca/hts/risc/pubs/tebiodiv/terranth/assets/arthropod.pdf
Other sources describing point counts include:
- Huff, M. H., K. A. Bettinger, H. L. Ferguson, M. J. Brown, and B. Altman. 2000. A habitat-based point-count protocol for terrestrial birds, emphasizing Washington and Oregon. General Technical Report PNW-GTR-501. U.S. Department of Agriculture, Forest Service, Pacific Northwest Research Station, Portland, Oregon. URL http://www.fs.fed.us/pnw/pubs/pnw_gtr501.pdf
The BC Ministry of Forests and Range has manuals for describing ecosystems and measuring vegetation, including:
- BC Ministry of Forests and Range. 2010. Field manual for describing terrestrial ecosystems, 2nd edition. BC Ministry of Forests and Range, Research Branch and BC Ministry of Environment, Resources Inventory Branch, Victoria, BC. URL http://www.for.gov.bc.ca/hfd/pubs/docs/Lmh/Lmh25-2.htm
An excellent reference for sampling vegetation, including a description of different sampling strategies (random, stratified random, systematic) is:
- Elzinga, C. L., D. W. Salzer, and J. W. Willoughby. 1998. Measuring and monitoring plant populations. U.S. Department of the Interior, Bureau of Land Management Technical Reference 1730-1. Denver, Colorado. URL http://www.blm.gov/nstc/library/pdf/MeasAndMon.pdf
See Chapters 5, Basic Principles of Sampling, 7, Sampling Design, and 8, Field Techniques for Measuring Vegetation.
Another general reference that can be purchased used (for a reasonable price, though you may need to search around) or new (for an absurd price) is:
- Brower, J. E., J. H. Zar, and C. N. von Ende. 1998. Field and laboratory methods for general ecology, 4th edition. WCB/McGraw-Hill, Boston.